Source: http://members.cox.net/alan.kolaga/
STARS!: Charts of habitability spread and mineral concentrations
By Alan L. KolagaLast Updated on 8/1/06
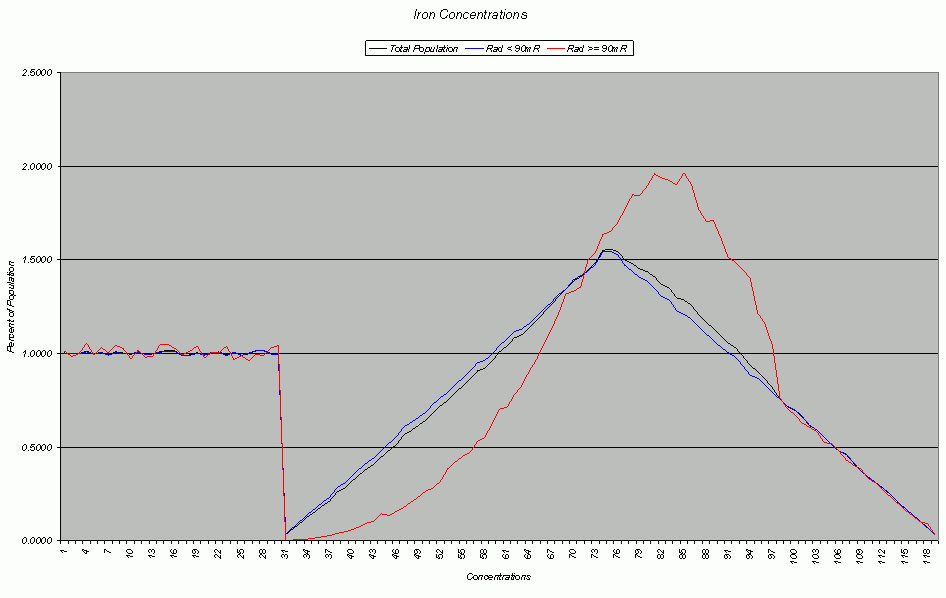
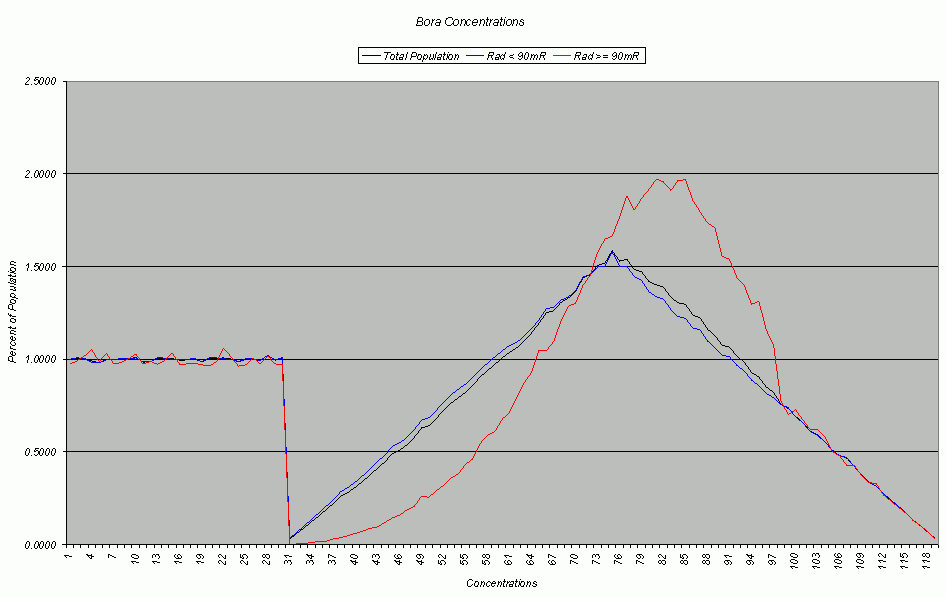
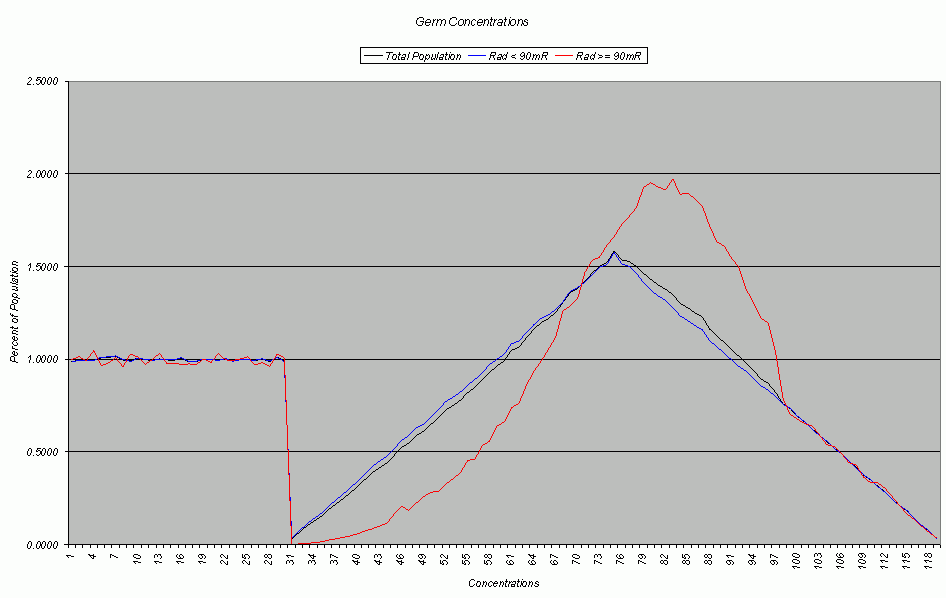
08/01/06: I have finally updated this web page. The following charts were created using a sample of over 100 million planets. All parameters are independent of each other with the exception of the mineral concentrations if Radiation is greater than 90mR.
04/04/06: Many thanks to Dogthinkers and Kelzar for showing me that my Mineral Charts were wrong. The increase in mineral concentrations only occurs in the HIGH extreme range of radiation (+40 to +49). I will have updated charts in a few days.
09/27/02: I have replaced the Mineral Chart with three new ones. Normal range is from 0 to ±39 clicks, Extreme range is from ±40 to ±49 clicks.
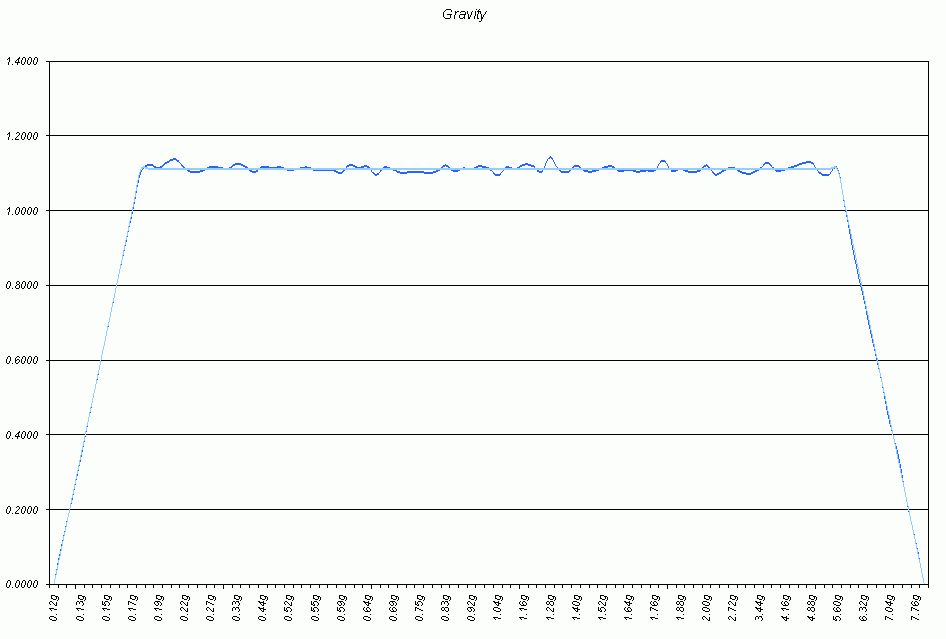
09/20/02: The following charts were created using a sample of 3,395,092 planets. You will notice the stair stepping on the low end of the Gravity chart. This is due to limitations of *.p1 file format. One interesting chart to look at is Mineral Concentration.
09/20/02: I used a tri-immune JoaT, so as to not unduly bias the sample. I also used a StarMOD to increase the planetary scanner to 4999/9999 ly range. These charts were created in Excel. I have all of my data available in a zip file. One file with all raw planetary data (56,217KB) and one file without the planetary data (34KB). If you would like a copy, please e-mail me.
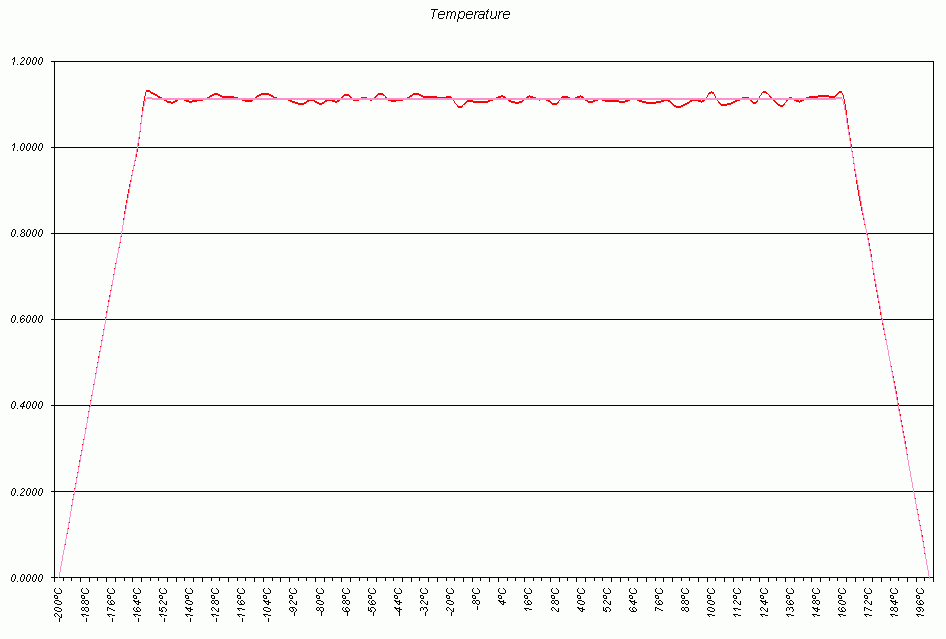
Gravity and Temperature population percentages are as follows:
±50 clicks from center: 0%±49 clicks from center: 0.1*(1/0.9)%
±48 clicks from center: 0.2*(1/0.9)%
±47 clicks from center: 0.3*(1/0.9)%
±46 clicks from center: 0.4*(1/0.9)%
±45 clicks from center: 0.5*(1/0.9)%
±44 clicks from center: 0.6*(1/0.9)%
±43 clicks from center: 0.7*(1/0.9)%
±42 clicks from center: 0.8*(1/0.9)%
±41 clicks from center: 0.9*(1/0.9)%
-40 thru +40 clicks form center: (1/0.9)%
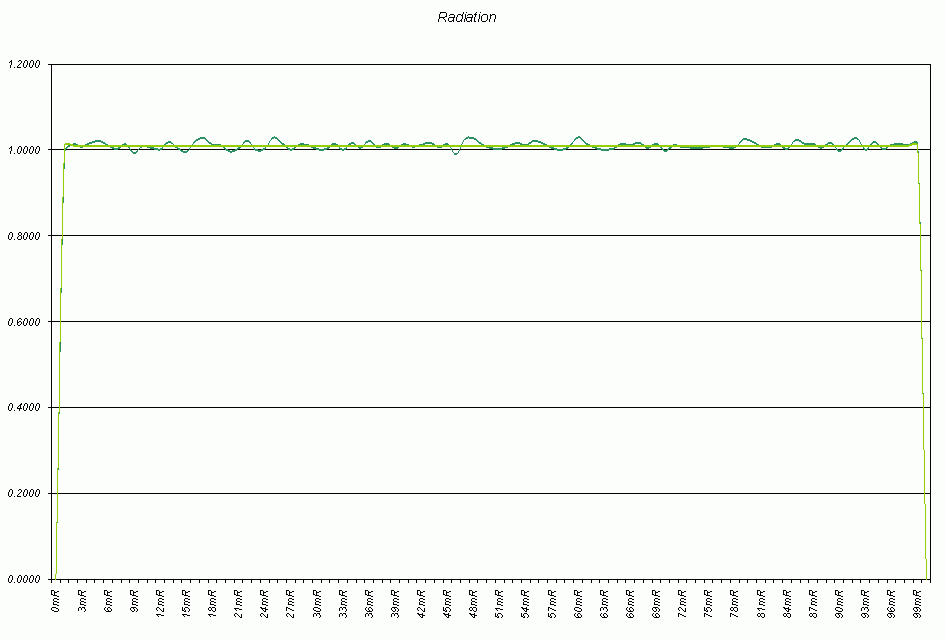
Radiation population percentages are as follows:
±50 clicks from center: 0%-49 thru +49 clicks from center: (1/0.99)%
Mineral concentrations
Last Updated on 8/1/06
By Alan L. Kolaga
Kontakt: alan.kolaga at 9spam cox.net (remove the 9spam.)
(html-code transformed and kb of images reduced by Altruist, Nov 2006)